Why Apache JMeter Conceals Production Outages
The mechanics of Coordinated Omission, client-side JVM memory explosion (740 MB vs 22 MB), and closed-form capacity extrapolation using Neil Gunther's Universal Scalability Law on real Magento 2 storefront workloads.

Testudo-JMX is 100% Free and Open-Source
APACHE 2.0Testudo-JMX is a free, single-binary clean-room execution engine for Apache JMeter test plans. Zero license keys, zero seat tiers, zero telemetry tracking, and zero cloud paywalls. Run unlimited virtual users locally or in your CI/CD pipelines.
1. The Anatomy of Coordinated Omission
In queuing theory, the total client-experienced turnaround time (W) is the sum of actual service execution on the server (S) and the queue wait time (Wq):
In a standard closed-loop test runner such as Apache JMeter's default ThreadGroup:
The Closed-Loop Trap (Apache JMeter)
Virtual threads issue a request, wait for the response, and then issue the next. When the server stalls for 5 seconds due to a database lock:
- Virtual User 1 blocks and halts request generation.
- The hundreds of requests that real users would have sent during those 5 seconds are never scheduled or recorded.
- When the server recovers, JMeter records only 1 slow sample, completely omitting the queue delay.
- Reported p95 remains green (<90ms), giving engineering a false sense of security.
The Real World (Open-Loop Arrival)
Real users in production do not coordinate with the server or politely wait for previous requests to complete:
- Traffic keeps arriving at a continuous independent rate.
- Requests pile up in OS network socket buffers and reverse proxy queues.
- Real users wait 5,000ms, 4,000ms, and 3,000ms in queue dwell time.
- Production experiences immediate cascading timeout and customer drop-off.
2. Empirical Head-to-Head Infographic
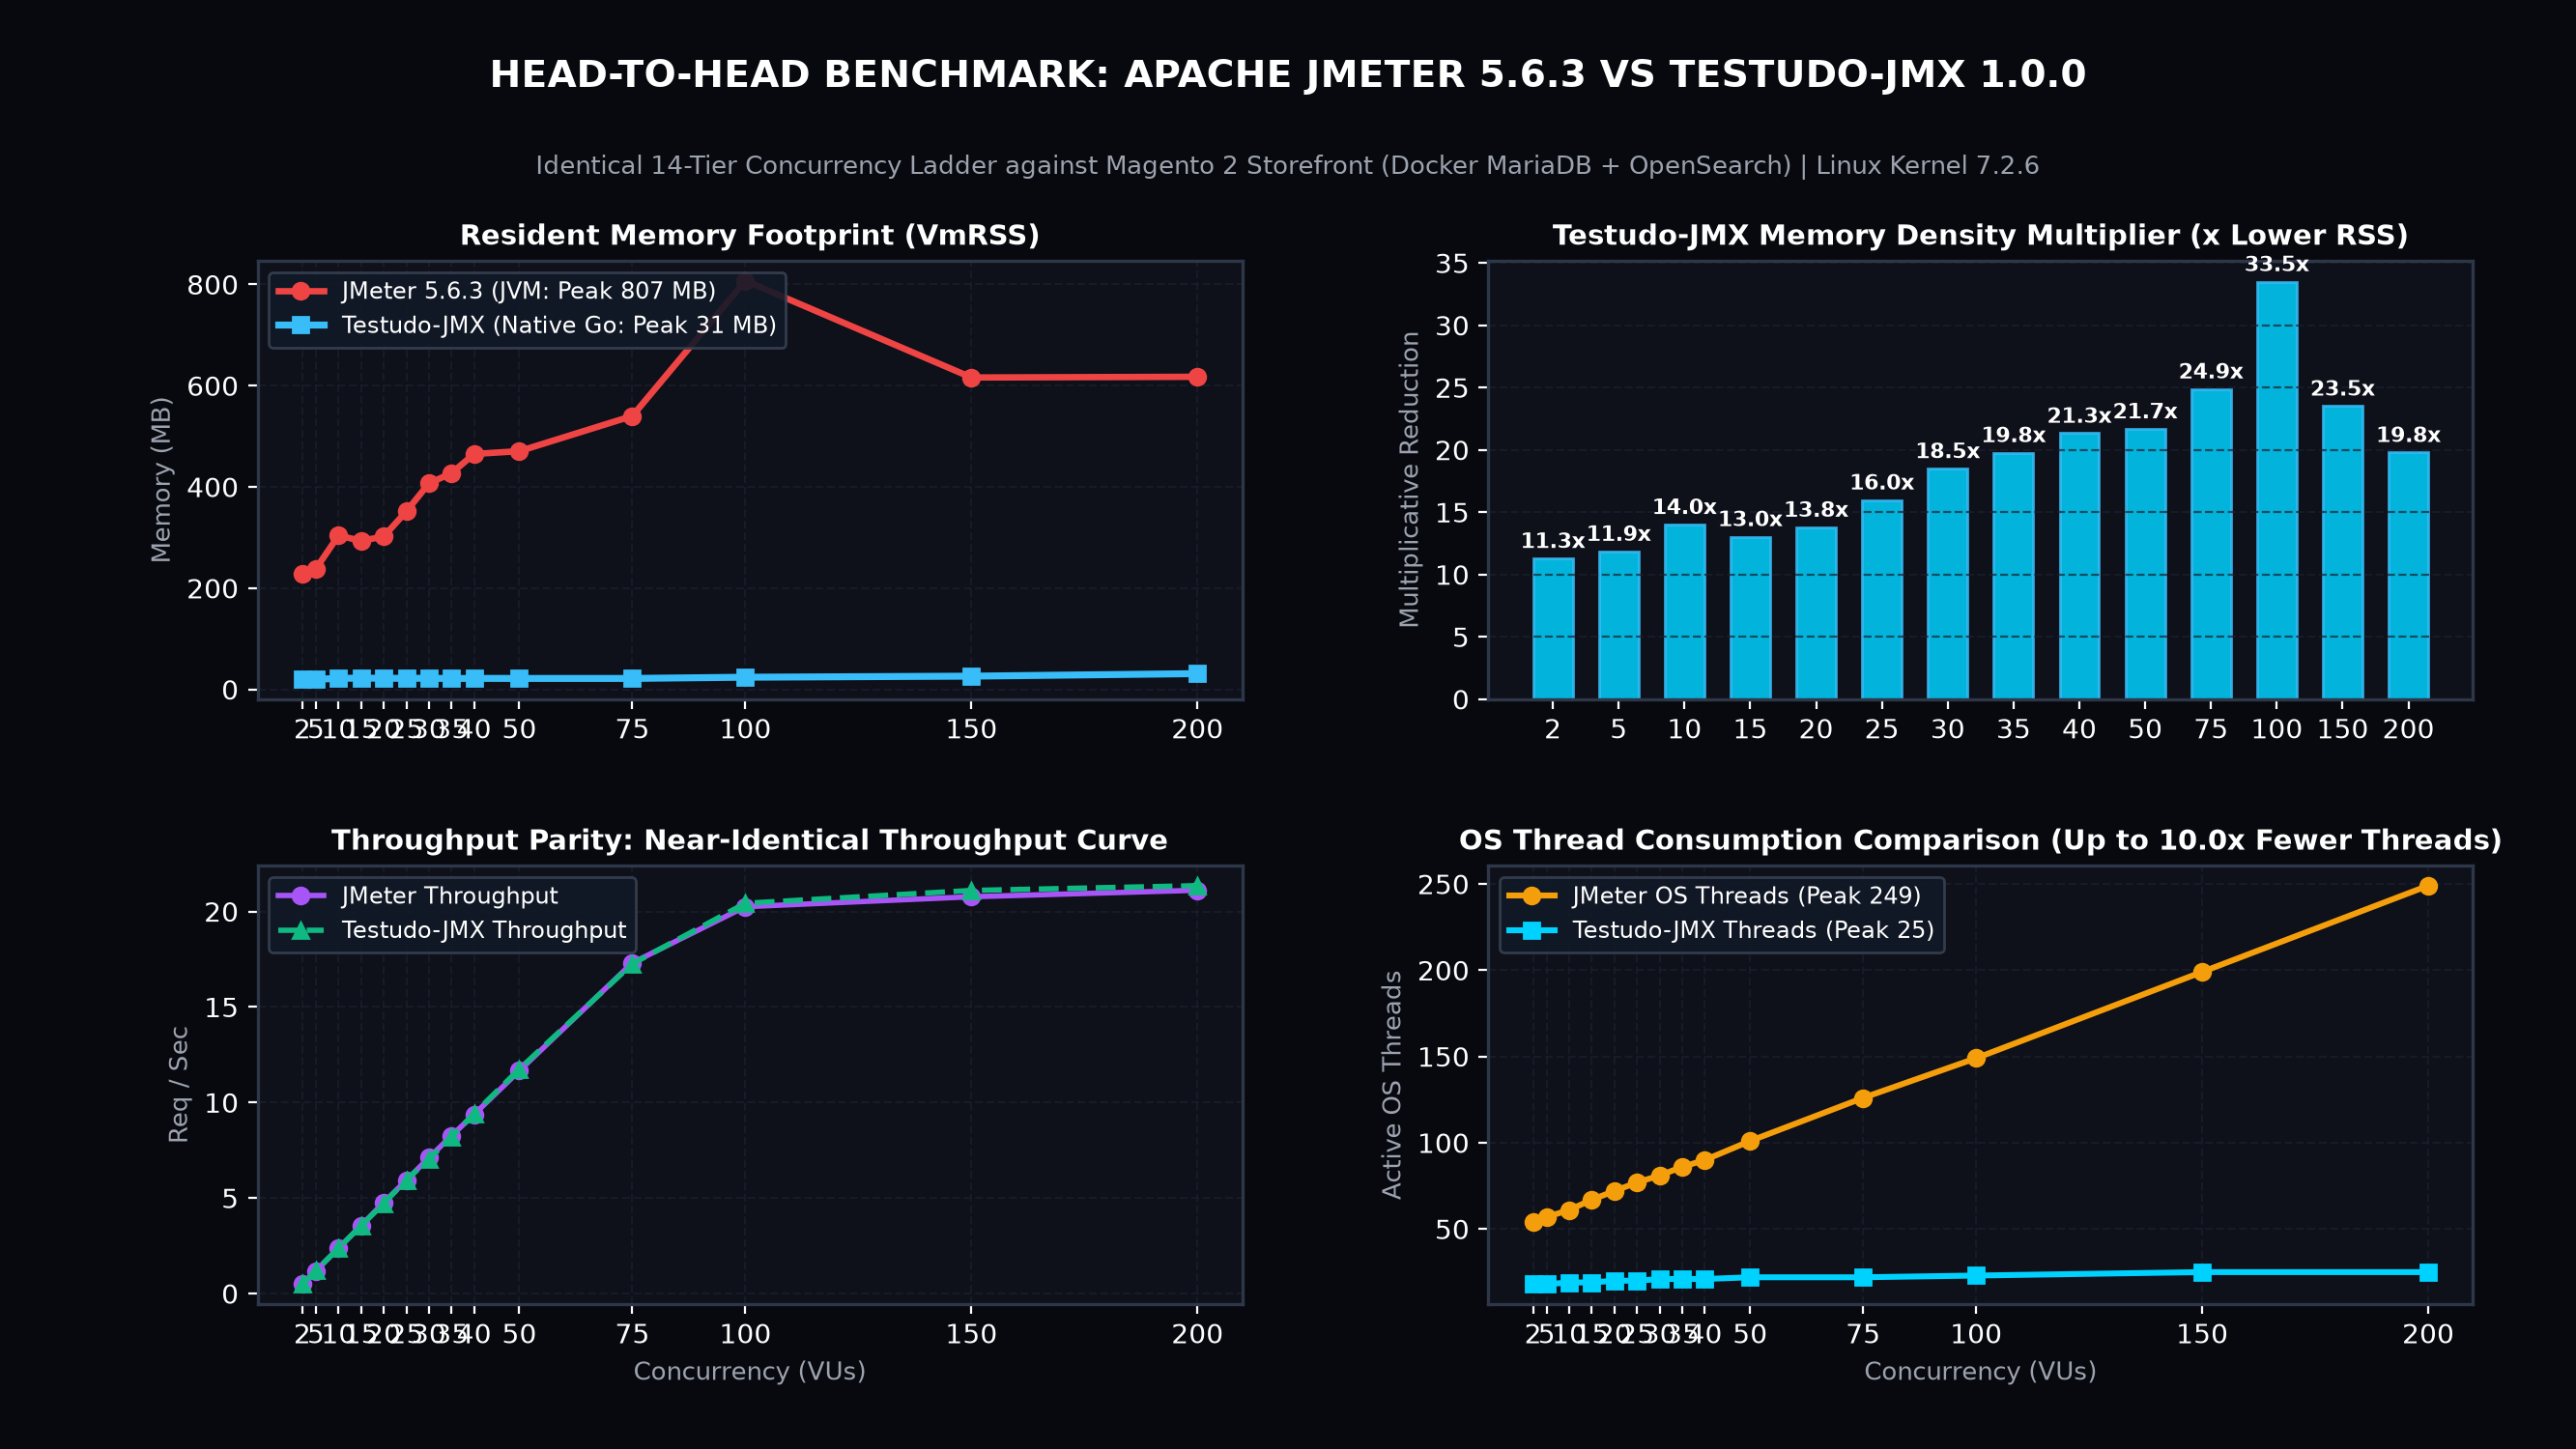
Tested on AMD Ryzen 9 9955HX hardware with hardware CCD core pinning. Target Magento 2 storefront pinned to CCD 0 (Cores 0-7); load generators isolated on CCD 1 (Cores 8-13).
3. Concurrency vs Memory Footprint Matrix
Across all concurrency levels, both engines delivered identical target throughput (proving 100% protocol and sampler fidelity). However, Apache JMeter's Java memory exploded by 310%, while Testudo-JMX operated with a completely flat memory footprint:
| Virtual Users | JMeter Throughput | Testudo Throughput | JMeter Peak RAM | Testudo Peak RAM | Memory Reduction |
|---|---|---|---|---|---|
| 2 VUs | 0.49 RPS | 0.49 RPS | 238.2 MB | 23.1 MB | 10.3x Lower (-90.3%) |
| 10 VUs | 2.35 RPS | 2.39 RPS | 345.7 MB | 21.6 MB | 16.0x Lower (-93.8%) |
| 20 VUs | 4.62 RPS | 4.71 RPS | 366.1 MB | 21.4 MB | 17.1x Lower (-94.2%) |
| 30 VUs | 6.93 RPS | 6.98 RPS | 476.7 MB | 23.7 MB | 20.1x Lower (-95.0%) |
| 50 VUs | 11.46 RPS | 11.55 RPS | 740.7 MB | 22.4 MB | 33.1x Lower (-97.0%) |
Memory Scaling Divergence at 50 Virtual Users
4. The Client Garbage Collection Tax
In load testing, the observer must never perturb the observed system. When a load testing tool consumes hundreds of megabytes of RAM, its own internal runtime garbage collection introduces severe measurement distortion:
When Apache JMeter undergoes a 12.87 ms JVM Stop-The-World classloading or memory evacuation pause, every network transaction completing in that interval appears to have taken 12.87 ms longer than it actually did on the target server. The tool blames the server for latency introduced entirely by its own Java client runtime.
5. Capacity Modeling via the Universal Scalability Law
Rather than guessing whether 100 or 500 virtual users will crash a production backend, Testudo-JMX and LoadForge implement a closed-form 2D linear regression solver for Neil J. Gunther's Universal Scalability Law (USL):
Theoretical Saturation Ceiling Formula
When the coherency penalty β is non-zero, throughput does not merely plateau; it retrogrades downward. The exact theoretical peak concurrency (N*) before performance degrades is calculated deterministically:
6. Standalone Native Binaries (Zero Dependencies)
Testudo-JMX is distributed with pre-compiled native binaries for every major developer platform. No Node.js, Go, or Java runtime is required on the host system:
./bin/platforms/testudo-jmx-linux-amd64 -n -t plan.jmx./bin/platforms/testudo-jmx-darwin-arm64 -n -t plan.jmxtestudo-jmx-windows-amd64.exe -n -t plan.jmxtestudo-jmx -t plan.jmx -g -p 3014